Barometric pressure: what high and low mean for your weather
Standard sea-level pressure is 29.92 inHg (1013.25 hPa), but highs and lows are defined by the air around them. How to read today's number, what the trend says about the next day, and why your phone shows a different number.
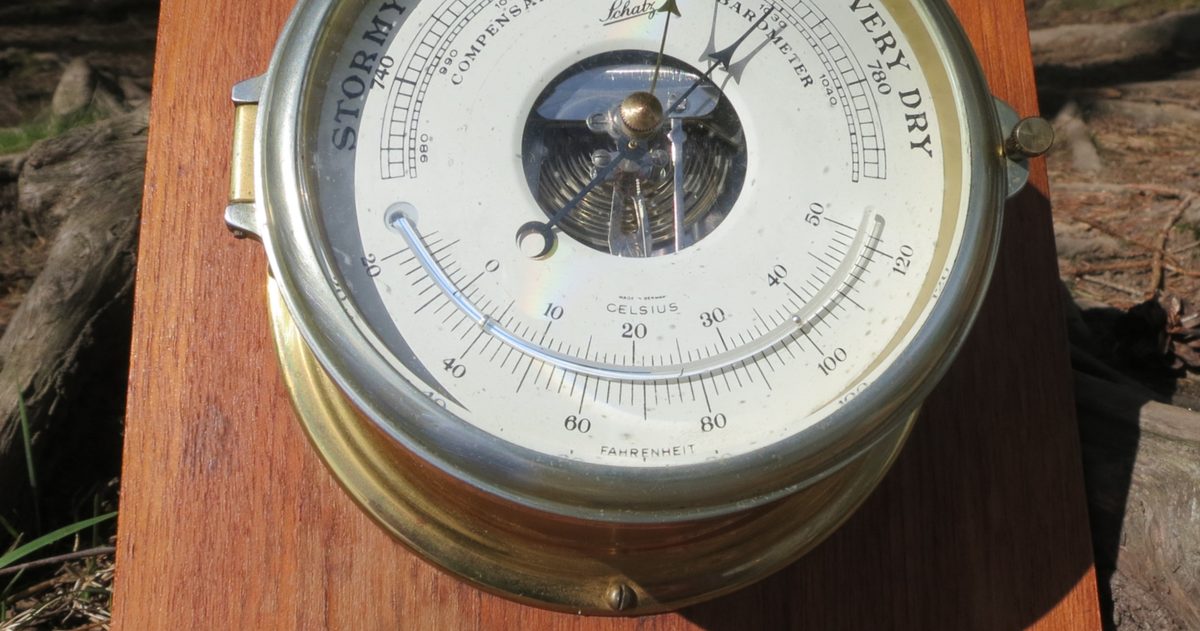
There is no fixed line between high and low barometric pressure: forecasters call an area high or low by comparing it with the pressure around it, not with one number. For your own reading, the reference point is standard sea-level pressure, 29.92 inches of mercury (1013.25 hPa), and most sea-level readings fall between 28.94 and 30.71 inHg (980 to 1040 hPa). Higher pressure often means settled weather and lower pressure unsettled weather, but which way the number has moved over the last three hours tells you more about the next day than the number itself.
What units is pressure measured in, and what is standard?
You will see three units, and two of them are the same thing:
- Inches of mercury (inHg): the height of a mercury column the air can hold up, and the unit US forecasts and broadcasts use.
- Hectopascals (hPa): the unit used in international meteorology, including by the WMO and the Met Office.
- Millibars (mb): identical to hectopascals. One hPa is exactly one mb, so 1013 hPa and 1013 mb are the same reading.
Standard pressure at sea level is 29.92 inHg, or 1013.25 hPa. To convert, multiply inches by 33.8639 to get hectopascals, or multiply hectopascals by 0.02953 to get inches. A change of 0.03 inHg is about 1 hPa.
Is the barometric pressure high today? How to read the number
Compare the reading in your app with this table. It uses sea-level values, the kind forecasts and broadcasts give (a later section explains why your own barometer may read lower).
| Sea-level reading | hPa (mb) | What it usually means |
|---|---|---|
| Above 30.71 inHg | Above 1040 | Unusually high. A very strong winter high reaches about 31.01 inHg (1050 hPa); higher than that is rare. |
| 29.92 to 30.71 inHg | 1013 to 1040 | Above the standard. Often settled: sinking air, light winds, few clouds. Warm and dry in summer; cold, still and frosty, sometimes foggy, in winter. |
| 28.94 to 29.92 inHg | 980 to 1013 | Below the standard. Often more changeable: rising air builds cloud, so rain and wind become more likely. |
| 28.05 to 28.94 inHg | 950 to 980 | Uncommon. A strong storm's center, the kind that brings heavy winter snow, is typically 960 to 980 hPa. |
| Below 28.05 inHg | Below 950 | Outside almost all sea-level readings. Intense hurricanes get down near 26.58 inHg (900 hPa). |
The Met Office sums it up in one line: generally, low pressure brings unsettled weather and high pressure settled conditions. It defines highs and lows relative to their surroundings, not by one reading in isolation, so treat the bands above as a guide. Around a high, winds are light and blow clockwise in the northern hemisphere; around a low, air rises and circulates counterclockwise, and the closer the isobars, the stronger the wind. In summer a high that settles over you can bring long, sunny, very warm spells, as in our guide to what causes UK heatwaves, and approaching high pressure is part of why the old rhyme in red sky at night works as often as it does.
Reading the barometer: what the 3-hour trend tells you
Forecasters care more about the change than the level. The National Weather Service reports pressure tendency over three-hour intervals, and the Met Office puts the change into words in its marine forecasts, on a scale it defines in hectopascals (inch equivalents in brackets):
| Change in 3 hours | Met Office wording | What it usually signals |
|---|---|---|
| 0.1 to 1.5 hPa (0.003 to 0.044 inHg) | Rising or falling slowly | Gradual change. A small dip can simply be the daily pressure cycle. |
| 1.6 to 3.5 hPa (0.047 to 0.103 inHg) | Rising or falling | Falling: a low or front is approaching. Rising: clearing, or a high building in. |
| 3.6 to 6.0 hPa (0.106 to 0.177 inHg) | Rising or falling quickly | A vigorous system nearby. Falling: a low or front approaching fast, or a low deepening. Rising: often the clearance behind a front. |
| More than 6.0 hPa (0.177 inHg) | Rising or falling very rapidly | A strong storm close by or deepening. Check for warnings. |
What does rising or falling pressure mean for the next 12 to 24 hours?
A University of Wisconsin weather course puts the rule simply: falling pressure usually means a storm, a low or a front, is approaching, while rising pressure goes with clearing or continued fair weather as a high moves in. NOAA adds the classic sign of a cold front: once it passes, pressure starts to rise, because the cold air behind it is denser. That is the sequence described in our guide to what a weather front is.
Two checks keep you from over-reading the needle:
- Allow for the daily cycle. NOAA notes that pressure naturally dips to a low around 4 a.m. and 4 p.m. and peaks around 10 a.m. and 10 p.m. A slow fall in mid-afternoon on a fine day is often just that.
- Watch for a sustained fall. NOAA calls a storm a "bomb cyclone" when the pressure at its center falls at least 24 hPa (0.71 inHg) in 24 hours at 60 degrees latitude, or about 17.8 hPa at New York's latitude: on average 3 hPa, or about 2.2 hPa near New York, every three hours for a whole day. Your barometer measures the pressure where you are, so a similar fall at home can also mean a storm is moving toward you.
What a home barometer cannot tell you is the hour. It says change is coming; the timing comes from the forecast models, which is exactly where they tend to disagree. Our guide to how weather forecasting works explains why, and on our Chicago forecast page, for example, the NWS blend, the American GFS and the European model sit side by side, so you can see whether they agree on when the change arrives.
Why does my app show a different number from the nearest station?
Because there are three different "pressures", and each serves a different purpose. The National Weather Service office in Boulder defines them:
- Station pressure is the true barometric pressure at the station's own elevation.
- Sea-level pressure is station pressure reduced to sea level using the temperatures actually observed. Meteorologists use it to track weather systems.
- Altimeter setting is reduced to sea level using a standard atmosphere instead. It is the number most often heard on radio and TV.
Elevation is the big one. Near the ground, pressure drops about 1 inHg for every 1,000 feet (about 34 hPa per 305 m) you climb, and NWS Boulder notes that places near 5,000 feet normally read on the order of 24 inHg (813 hPa). So a barometer app in a mountain city near 5,000 feet can show about 24 inches while the forecast for the same street shows a sea-level figure near 30. Phones add their own quirks: a 2025 study in Atmospheric Measurement Techniques notes that individual smartphones can read noticeably differently, and found that the most abnormal readings came from people on high floors of tall buildings. A gap of several inches means one of the two numbers is station pressure; smaller gaps come from the different reductions above, from rounding, or from readings taken at different times.
What are the highest and lowest pressures ever recorded?
| Record | inHg | hPa (mb) | Where and when |
|---|---|---|---|
| World highest (station below 2,461 ft) | 32.01 | 1083.8 | Agata, Siberia, Russia, December 31, 1968 |
| World highest (station above 2,461 ft) | 32.16 | 1089.1 | Tosontsengel, Mongolia, December 30, 2004 |
| World lowest | 25.69 | 870 | Eye of Typhoon Tip, western Pacific, October 12, 1979 |
| US highest | 31.85 | 1078.6 | Northway, Alaska, January 31, 1989 |
| US lowest | 26.35 | 892.3 | Matecumbe Key, Florida, September 2, 1935 |
| British Isles highest | 31.11 | 1053.6 | Aberdeen Observatory, January 31, 1902 |
| British Isles lowest | 27.33 | 925.6 | Ochtertyre, Perthshire, January 26, 1884 |
The pattern is the point: record highs come from bitterly cold winter air over land, as at Northway, Alaska, and record lows come from the eyes of tropical cyclones and the deepest winter storms. Both British Isles extremes were set in January.
Can barometric pressure cause headaches or joint pain?
Many people with chronic pain believe their pain follows the weather, and some studies find a link, but the effect is small and the evidence is weak. What the research shows:
- Migraine diaries: a Japanese study of 28 patients found migraines were more frequent on days followed by a pressure fall of more than 5 hPa (0.15 inHg) by the next day, and weather changes were associated with attacks in 18 of the 28. It is a very small sample.
- Emergency visits: a Boston study of 7,054 headache patients found higher temperature was the clearer trigger; lower pressure two to three days earlier raised the risk of non-migraine headaches "to a lesser degree".
- Chronic pain: a UK smartphone study of 2,658 people over 15 months found pain was a little more likely on low-pressure days (odds about 4% lower per 10 hPa rise), with humidity mattering more. The worst weather combination raised the odds of a painful day by just over 20%, and the pressure link showed up only in people who already strongly believed the weather affected their pain.
- The evidence overall: a 2025 systematic review of 14 migraine studies found pressure changes may raise attack frequency but called the evidence limited by small samples and self-reported data. A BMJ analysis of 11.7 million US doctor visits by people aged 65 and over found no link between rainy days and visits for joint or back pain.
If you get migraines, the NHS suggests keeping a migraine diary to help work out your own triggers; noting the day's pressure alongside it costs nothing and gives you your own answer rather than an average.
The short version
Use 29.92 inHg (1013 hPa) as a reference point, not a dividing line, and read the three-hour trend to know which way the weather is heading. A rising barometer is a good sign for tomorrow; a quick, sustained fall means a front or storm is on the way. For when it arrives, check the forecast, and when the models disagree on the timing, see why weather forecasts disagree.