How Does Weather Forecasting Work? A Plain-English Guide
A no-jargon tour of how a modern forecast is built, from weather balloons to supercomputers, and why comparing models is the smartest way to read one.
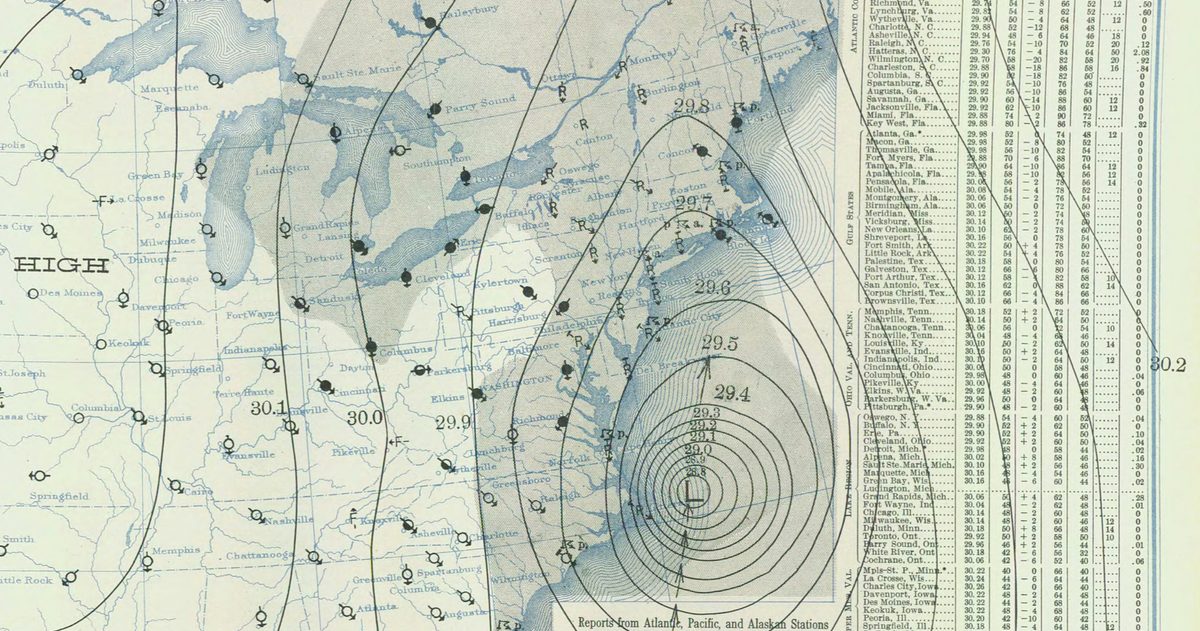
Every forecast you have ever seen, whether on a phone app, a TV bulletin, or a website, is the end product of the same basic machine: measure the atmosphere now, feed those measurements into physics equations, and let a computer march that physics forward in time. The details are genuinely complicated, but the shape of the process is not. Here is how it actually works, in plain English.
Step one: measuring the atmosphere
A forecast is only as good as its starting picture, so the first job is to observe the current state of the sky all over the planet. That data comes from a surprisingly diverse fleet of instruments:
- Satellites watch cloud, moisture, and temperature from orbit, giving global coverage over oceans and deserts where nothing else is looking.
- Weather balloons (radiosondes) are launched twice a day from hundreds of sites and rise through the atmosphere sampling temperature, humidity, pressure, and wind at every altitude.
- Surface stations at airports, farms, and towns log ground-level conditions minute by minute.
- Commercial aircraft report wind and temperature automatically as they fly their routes.
- Ocean buoys and ships fill in sea-surface temperature and pressure across otherwise empty water.
Millions of these observations pour in every day. A process called data assimilation stitches them together with the previous forecast to build the single best estimate of what the atmosphere looks like right now. That snapshot is the launch pad.
Step two: what a weather model actually does
A numerical weather prediction (NWP) model chops the atmosphere into a three-dimensional grid of boxes, wrapping the whole globe and stacking upward through the layers of air. For every box it stores values like temperature, pressure, humidity, and wind. Then it applies the laws of physics, the same fluid-dynamics and thermodynamics equations that govern how air moves and heat transfers, to calculate how each box will change over the next few minutes. It repeats that calculation step by step, box by box, marching forward until it has built a picture hours or days into the future.
This is staggeringly heavy arithmetic, which is why national weather services run it on some of the largest supercomputers on Earth. Finer grids capture more detail, like an individual thunderstorm, but cost far more computing power, so there is always a trade-off between resolution and speed.
The major global models
A handful of institutions run the big global models, and their output is the raw engine beneath almost every consumer forecast:
- GFS (Global Forecast System), the American model run by NOAA.
- ECMWF, the European model, widely regarded as one of the strongest global performers.
- UKMO, the UK Met Office global model.
- ICON, the German model from Deutscher Wetterdienst.
Here is the part most people never hear: the big consumer apps do not run their own physics. Apple Weather, The Weather Channel, AccuWeather, and the BBC all blend and repackage these same underlying public models. When two apps disagree, it is usually because they leaned on different models, or blended them differently, not because one has secret data. You can explore the models directly for your area on our compare US forecasts pages.
Ensembles: measuring the uncertainty
Because the starting snapshot is never perfect, forecasters do not run a model just once. They run it many times, each with tiny deliberate tweaks to the initial conditions, and see how far the outcomes spread apart. This is called an ensemble.
If all the ensemble members land in roughly the same place, confidence is high. If they scatter wildly, the atmosphere is in an uncertain mood and any single forecast should be trusted less.
That spread is where the honest probabilities come from. A "40 percent chance of rain" is not a hedge; it is a real measurement of how many plausible versions of tomorrow came out wet.
Why forecasts fade with time
The atmosphere is a chaotic system, meaning tiny errors in the starting picture grow larger the further ahead you predict. The meteorologist Edward Lorenz captured this with the famous butterfly metaphor: a minuscule difference now can lead to a completely different outcome later. There is no fixing this with a bigger computer; it is a fundamental limit of the physics.
The practical result is a reliable gradient. Tomorrow's forecast is usually excellent. By day five it is good for the broad picture, and modern five-day temperature forecasts from centres like NOAA and ECMWF are broadly reported as reliable most of the time. Beyond a week or so, models are better at trends and probabilities than at pinning down a specific afternoon.
The smart way to read a forecast
All of this leads to one simple habit. Instead of trusting whichever app you happen to have open, look at what several independent models are saying and check whether they agree. When GFS, ECMWF, and the others line up, you can plan with confidence. When they split, that disagreement is itself the forecast: it is telling you the outcome is genuinely uncertain, which is exactly when a single-number app quietly hides the doubt.
That is the whole idea behind comparing models side by side. It is not about finding one magic source that is always right, because none exists. It is about reading the agreement and the disagreement honestly. If you want to see how the models have actually performed against each other, our which US forecast is most accurate breakdown lays it out.
Once you know how a forecast is made, the misses make more sense: see why the forecast is sometimes wrong.