Why Do Weather Forecasts Disagree?
Different models, different data, and a chaotic atmosphere mean disagreement is normal, and useful.
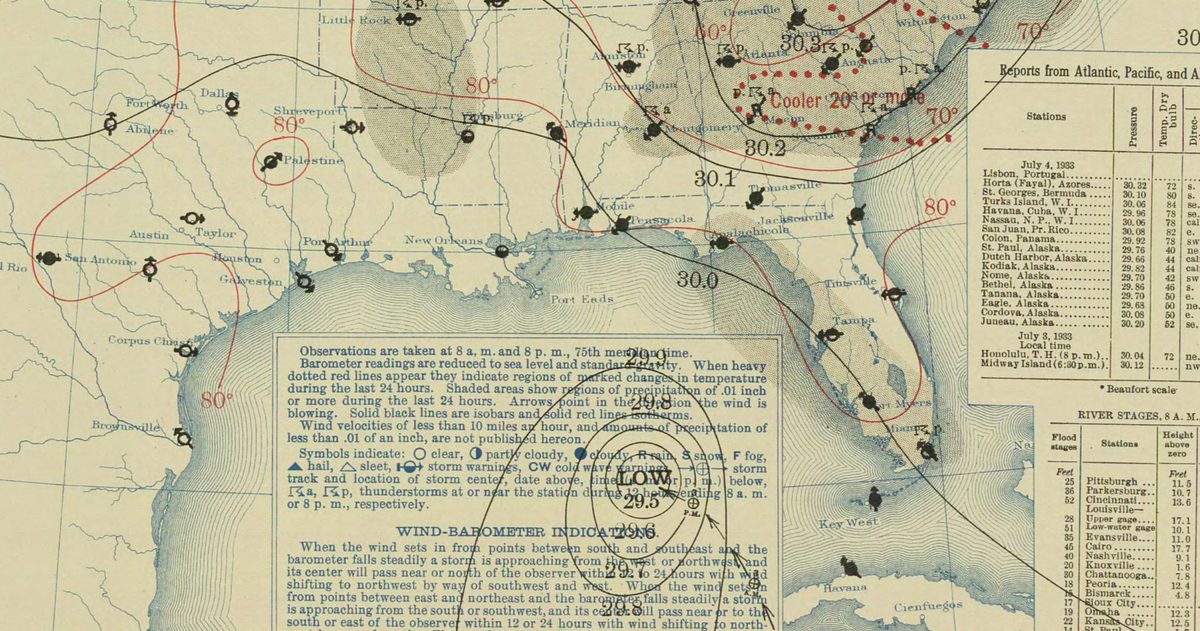
Weather forecasts disagree because they are built on different computer models that use different resolutions, data, and physics, and because the atmosphere is chaotic, so small differences in the starting conditions grow into different outcomes. When two apps show different forecasts for the same day, they are usually just leaning on different models, and that disagreement is itself a useful measure of how uncertain the forecast is.
Different apps use different models
There is no single official forecast that every app copies. Instead, apps draw on global models such as the American GFS (run by NOAA), the European ECMWF, and the German ICON, and each app blends them differently. One app may weight the ECMWF heavily while another leans on the GFS, so for the same city and day they can legitimately disagree. Neither is necessarily "wrong"; they are reflecting different models.
The models themselves disagree
Even before any app blends anything, the underlying models differ in ways that produce different answers.
| Difference | Why it causes disagreement |
|---|---|
| Resolution | A finer grid (ECMWF ~9 km vs GFS ~13 km) resolves different detail |
| Data assimilation | Models blend observations into a starting state differently |
| Physics | Each represents clouds, rain, and turbulence with different equations |
| Update timing | The GFS runs 4x daily, the ECMWF 2x, so one may be newer |
These are not bugs. They are legitimate scientific choices, and they are exactly why running several models is more informative than trusting one.
The atmosphere is chaotic
The deepest reason forecasts disagree is chaos. In the 1960s Edward Lorenz discovered that tiny changes in a weather model's starting conditions lead to wildly different results, an idea now known as the butterfly effect. Because we can never measure every point of the atmosphere perfectly, each model starts with slightly different small errors, and those errors amplify over time. Two reasonable forecasts can diverge simply because they began from very slightly different starting points.
A familiar example: the borderline snowstorm
Picture a winter storm four days out along the East Coast. The GFS drives the low a little farther offshore and gives your city three inches of snow. The ECMWF pulls the low slightly closer and gives you ten inches of snow changing to rain. The ICON splits the difference. All three are physically reasonable; they simply started from marginally different pictures of the atmosphere and made different but defensible choices about the storm's path. This is why one app can promise a blockbuster while another shrugs, and why the forecast can swing from day to day as the models digest new observations and gradually converge, or diverge, as the storm approaches.
The lesson is not that forecasters are guessing. It is that a genuinely uncertain situation should look uncertain, and honest forecasting shows you that range instead of hiding it behind one confident number.
Disagreement is information, not noise
Here is the reframe that changes how you read forecasts: disagreement is data. When the GFS, ECMWF, and ICON all show rain Saturday afternoon, confidence is high. When one says a washout, another says cloudy, and a third says sunny, the honest answer is that the outcome is genuinely uncertain. Forecasters formalize this with ensembles, running a single model dozens of times from slightly different starts. NOAA's GEFS uses 31 members and the ECMWF ensemble uses 51; the spread among members is a direct measure of confidence.
Most weather apps hide this behind one clean icon, which is exactly why a confident-looking forecast can be built on shaky agreement. checkweather.io takes the opposite approach: it lines up the GFS and ECMWF side by side, turns their agreement or disagreement into a plain-English confidence score, and grades them on an accuracy scoreboard against what actually happened. No black boxes, just the disagreement made visible.
What should you do when forecasts disagree?
- Check more than one source. If several independent forecasts agree, trust them more.
- Look for the confidence, not just the icon. A single icon hides how sure the model is.
- Weight the short range. Disagreement usually grows with lead time, so near-term forecasts that agree are especially trustworthy.
- Re-check as the day nears. Models often converge as the event approaches and the starting data improves.
- Heed official watches and warnings. When the National Weather Service issues a warning, the hazard is occurring or imminent, regardless of what a single app shows.
Does more computing power fix the problem?
Faster supercomputers and finer grids have made forecasts dramatically better over the decades, and they will keep improving. But no amount of computing power erases chaos. Even a perfect model fed slightly imperfect starting data will eventually diverge from reality, because the atmosphere amplifies tiny uncertainties. That is why the goal of modern forecasting is not to eliminate disagreement, which is impossible, but to measure it honestly and communicate it clearly. Ensembles, probability forecasts, and side-by-side model comparisons are all tools for doing exactly that.
The bottom line
Forecasts disagree because they come from different models with different designs, fed different data, simulating a fundamentally chaotic atmosphere. That is not a failure of forecasting; it is an honest reflection of real uncertainty. The next time two apps contradict each other, resist the urge to decide one is broken. Instead, ask what the models are collectively telling you: broad agreement means plan with confidence, and a wide split means keep your options open and check again tomorrow. The best way to use disagreement is to compare forecasts and treat their agreement as a confidence gauge, so it works for you instead of confusing you.
Rather than trust a single forecast, see which US forecast is most accurate.
Disagreement between models is one thing; a forecast that simply turns out wrong is another. We break down the five reasons in why the weather forecast is sometimes wrong.