How to Read a US Weather Radar
Once you know what reflectivity, dBZ, velocity, and the base-versus-composite views actually show, a radar map tells a real story.
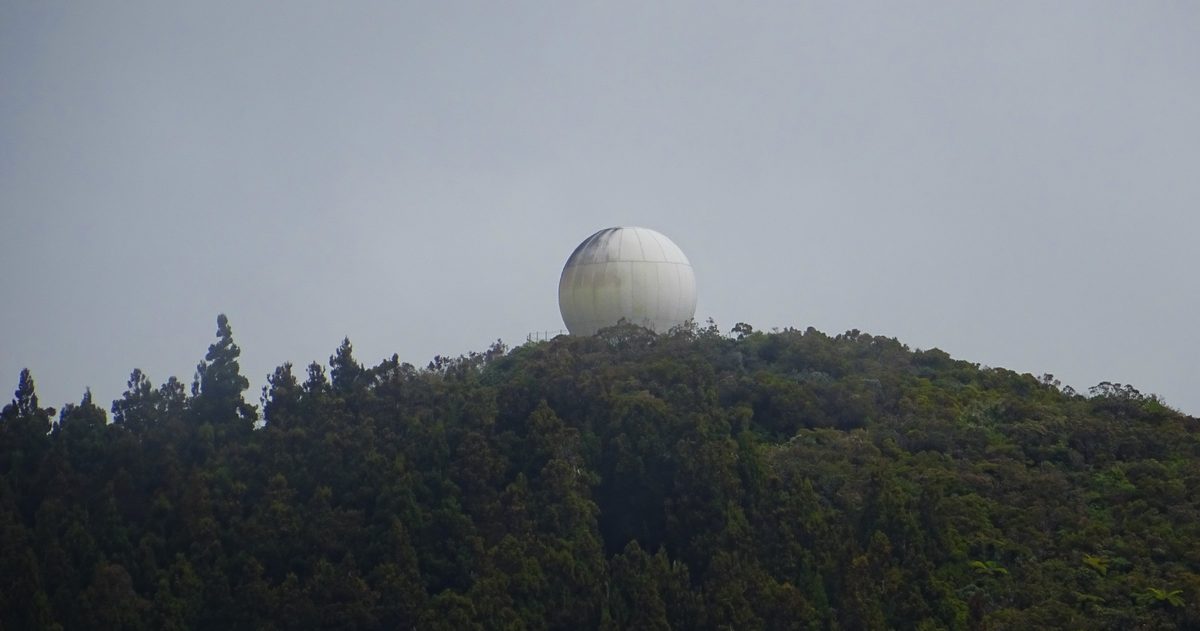
To read a US weather radar, focus on four things: reflectivity (how heavy the precipitation is, measured in dBZ, with warmer colors meaning heavier rain or hail), velocity (whether air is moving toward or away from the radar, which reveals rotation), and whether you're viewing a base product (one tilt/elevation) or a composite (the strongest returns from all tilts). Together they show where, how heavy, and how organized the weather is.
How does weather radar work?
US weather radar runs on the National Weather Service's NEXRAD network of WSR-88D radars. Each radar sends out pulses of microwave energy and listens for the tiny fraction that bounces back off raindrops, snow, hail and other targets. The time it takes to return gives distance; the strength of the return gives intensity; and the shift in the returned signal's frequency (the Doppler effect) gives motion. The radar sweeps in a rotating cone, stepping up through several tilt angles to build a 3-D picture of the atmosphere around it.
What is reflectivity and how do you read the colors?
Reflectivity measures how much of the radar beam is bounced back by raindrops, snowflakes or hail. More and bigger targets return a stronger signal. The strength is expressed in dBZ (decibels relative to Z), and forecast maps map dBZ values to a color scale, cool blues and greens for light precipitation, yellows and oranges for heavier rain, and reds and magentas for the most intense cores. As a rough guide:
| dBZ range | Typical meaning | Usual color |
|---|---|---|
| 5-20 | Light rain, drizzle or snow | Blue / light green |
| 20-40 | Light to moderate rain | Green to yellow |
| 40-50 | Heavy rain, possible thunderstorm | Orange |
| 50-65+ | Very heavy rain, likely hail in a strong storm | Red to magenta / white |
The exact thresholds vary by display, but the principle holds: higher dBZ means a stronger return, which usually means heavier precipitation. Very high dBZ values (roughly 60+) often signal large hail rather than just rain.
What is velocity and why does it matter?
Doppler radar also measures velocity, the speed of targets moving toward or away from the radar along the beam. On velocity displays, one color family (commonly greens) shows motion toward the radar and another (commonly reds) shows motion away. When you see strong inbound and outbound winds packed tightly side by side, a "velocity couplet", that indicates rotation. Forecasters use this to spot the mesocyclone of a supercell and to issue tornado warnings. A tight, intense couplet at low levels can flag a possible tornado, sometimes accompanied by a debris signature on dual-polarization radar.
One limitation: radar only sees motion along its beam, toward or away, so wind blowing exactly perpendicular to the beam can read as zero. Reading velocity well means accounting for the storm's position relative to the radar site.
Base vs composite reflectivity: what's the difference?
US radars scan in a cone, sweeping at several tilt angles (elevation "slices"). That gives two common reflectivity products:
- Base reflectivity shows the return from a single elevation angle, usually the lowest tilt. Because the beam rises with distance from the radar, base reflectivity closest to the radar shows near-ground precipitation, while far away it samples higher in the storm.
- Composite reflectivity shows the maximum reflectivity found at any tilt over each point. It reveals the strongest core of a storm, even if that intensity is aloft, so it's better for spotting a storm's true strength and hail potential.
A practical takeaway: composite reflectivity can look more intense than base because it captures high-altitude cores. If a storm is much stronger on composite than base, dangerous weather may be aloft and not yet at the surface.
What does dual-polarization add?
Modern NWS radars (the NEXRAD/WSR-88D network) are dual-polarization, sending pulses both horizontally and vertically. This helps distinguish rain from hail, snow and sleet, and can reveal a tornado debris signature (TDS), lofted debris that confirms a tornado is on the ground, an important real-time warning tool. It also helps forecasters spot the melting layer in winter storms and estimate rainfall more accurately.
What are radar's limitations?
- Beam height: far from the radar, the beam is high in the sky and misses low-level rain or snow.
- Ground clutter and blockage: terrain, buildings and even birds or bugs can produce returns.
- Bright band and hail spikes: melting snow and large hail can inflate or distort readings.
- No forecast: radar shows what is happening now, not what will happen next.
From radar to forecast
Radar tells you what's occurring in real time; forecast models tell you what's coming. Reading both together is how you get ahead of weather. On checkweather.io you can line up the American GFS and European ECMWF models side by side and check a forecast-confidence score that flags when they disagree, so the radar you watch today matches a forecast you can trust tomorrow. No black boxes.
To judge how reliable this is, see which US forecast is most accurate.