How to read Canadian weather radar
ECCC's radar sends out radio pulses and measures the echo bouncing off raindrops, snow and hail. Colours show intensity from light green to deep red; the brighter the colour, the heavier the precipitation. Here is how to read the map with confidence.
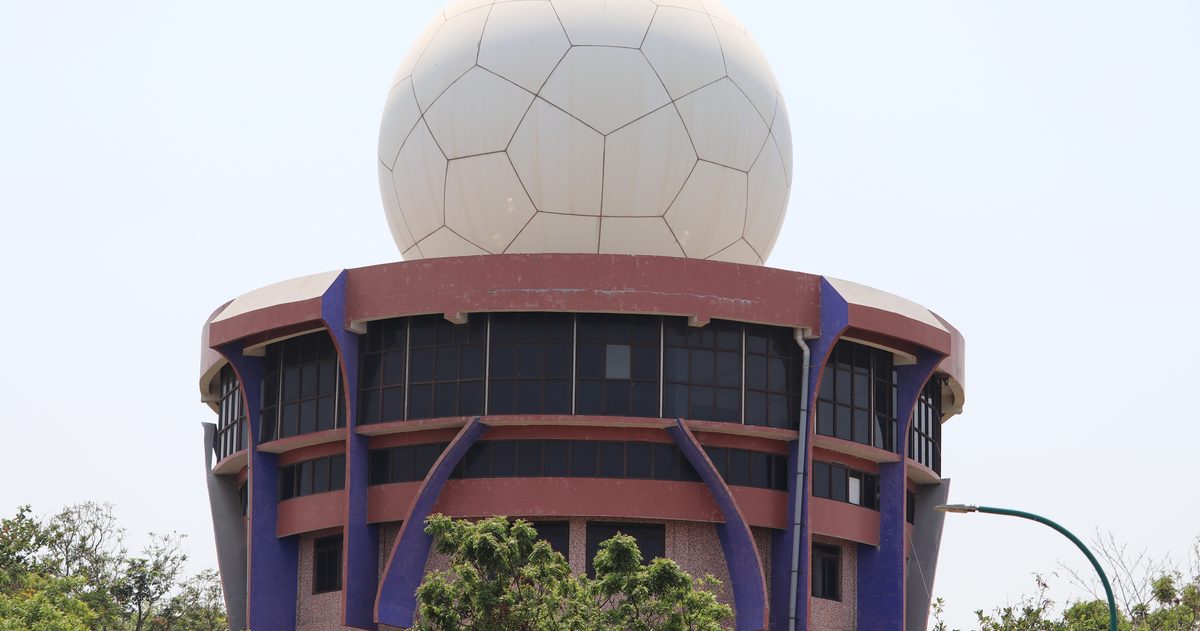
Weather radar works by sending out pulses of radio energy and measuring the signal that bounces back off precipitation. Environment and Climate Change Canada (ECCC) turns that echo into the colourful maps at weather.gc.ca: greens and blues mean light precipitation, yellows and oranges mean moderate to heavy, and reds mean intense rain or storms. The stronger the returned signal, the brighter the colour. Learn that scale and the rest follows.
What is radar actually measuring?
Radar measures reflectivity - how much of its pulse is scattered back by objects in the air, mostly raindrops, snowflakes and hail. Bigger and more numerous droplets return a stronger echo. Reflectivity is expressed in decibels of reflectivity (dBZ): the higher the dBZ, the heavier the precipitation. A drizzle might show around 20 dBZ, steady rain 30 to 40 dBZ, and a severe thunderstorm core 50 dBZ or more, which is where you see deep red and often hail.
What do the radar colours mean?
ECCC maps precipitation intensity with a colour ramp. The exact palette can differ slightly between the rain and snow scales, but the principle is constant - darker, warmer colours mean more intense precipitation.
| Colour band | Rough intensity | What it usually means |
|---|---|---|
| Light green / blue | Light | Drizzle or light rain/snow |
| Green | Light to moderate | Steady rain |
| Yellow | Moderate | Heavier rain, a building shower |
| Orange | Heavy | Downpour, likely thunderstorm |
| Red / magenta | Very heavy / intense | Strong storm core; possible hail |
Always glance at the legend on the ECCC page, because the snow scale and rain scale use different thresholds - the same green can mean a different rate depending on which one you are viewing.
What is dual-polarization radar, and why does it matter?
ECCC has modernized its network to dual-polarization S-band radars, replacing older single-polarization units. "Dual-pol" sends pulses both horizontally and vertically, which lets the radar sense the shape of what it is hitting. That is a big deal, because it helps distinguish:
- Rain (flattened, oblate droplets) from snow and hail (different shapes);
- Actual precipitation from non-weather echoes like birds, insects, dust or ground clutter;
- The likely presence of large hail in a storm core.
The upshot for you is cleaner, more trustworthy maps and better warnings - fewer false echoes, and a clearer read on whether that band is rain or wet snow.
How do I tell rain from snow on radar?
ECCC provides separate rain and snow radar products, and the site indicates precipitation type. A few practical cues: snow generally returns weaker echoes than heavy rain for the same "amount," so a light-looking green band in winter can still be meaningful snowfall. Watch the freezing level too - a storm may show as rain at low elevations and snow on nearby high ground. When in doubt, cross-check the radar against the current surface temperature and the forecast precipitation type.
Can radar show storm rotation and tornadoes?
Yes - through a product called Doppler velocity. Doppler radar measures how fast precipitation is moving toward or away from the radar, which reveals wind within a storm. A tight couplet of air moving toward the radar right beside air moving away signals rotation (a mesocyclone), a red flag for severe storms and possible tornadoes. Dual-pol can even detect a debris signature - lofted debris - that helps confirm a tornado is on the ground. This is a core tool behind ECCC's tornado warnings.
What are radar's blind spots?
Radar is powerful but not perfect, and reading it well means knowing its limits:
- The beam rises with distance. Far from a radar site, the beam is high above the ground and can miss shallow, low-level precipitation - snow especially.
- Terrain blocks the beam. Mountains cause "beam blockage," leaving gaps in coverage in parts of B.C. and other rugged areas.
- Ground clutter and false echoes. Buildings, wind farms, birds and insects can appear as echoes, though dual-pol filters many of these out.
- Bright banding. Melting snow can exaggerate reflectivity in a ring around the radar, overstating intensity.
What is a CAPPI, and why does the map look the way it does?
ECCC's standard web radar image is often a CAPPI - a Constant Altitude Plan Position Indicator - which stitches together the radar's sweeps into a horizontal slice of the atmosphere at a set height. In plain terms, it is a top-down "map view" of where precipitation is falling, rather than a raw single-angle scan. The site also loops recent frames so you can watch a system move. Reading that animation is the single most useful skill: it shows not just where rain is, but which way it is heading and whether the cells are strengthening (colours brightening) or fading (colours washing out). A storm core deepening from orange to red as it tracks toward you is a clear cue to take cover before it arrives.
How does radar fit with the forecast?
Radar tells you what is happening now and over the next short while - it is the ultimate "is it about to rain on me" tool. Forecast models tell you what is coming over hours and days. The two work best together: use the models to know a storm system is on the way, then use radar to track it in real time. That mirrors how checkweather.io works - we compare ECCC's GEM against ECMWF and GFS to build a forecast-confidence score for the days ahead, then keep an accuracy scoreboard against what actually recorded, while radar shows the play-by-play. No black boxes, just the clearest possible picture.
Quick tips for reading ECCC radar
- Check the legend first - rain and snow scales differ.
- Brighter colour equals heavier precipitation (higher dBZ).
- Loop the animation to see which way a storm is moving and whether it is growing.
- In winter, do not dismiss light-green bands - snow echoes are weaker than rain.
- Cross-check radar against the surface temperature to judge rain-versus-snow near the freezing line.
Before you rely on one app, see which Canadian forecast is most accurate.