How to read Australian weather radar (the BOM radar)
The BOM rain radar shows where rain is falling and where it is heading. Here is how to read the colours, pick the right range, loop the frames and spot its blind spots.
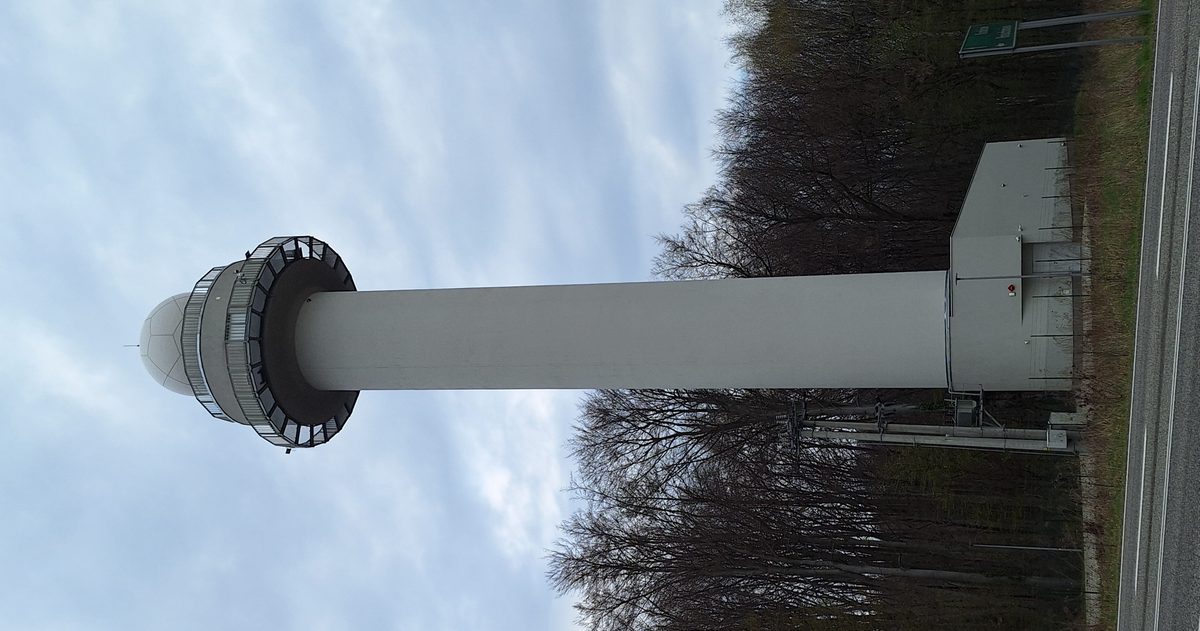
The Bureau of Meteorology's weather radar, the "rain radar" at bom.gov.au or in the BOM Weather app, shows where rain is falling right now and which way it is moving. Colours run from light blue (drizzle) through green and yellow to red and purple (intense rain or hail). Play the loop and watch the frames to work out a storm's direction and speed.
What is the BOM radar actually showing?
A weather radar sends out pulses of microwave energy and measures how much bounces back off raindrops, hailstones and snowflakes. More and larger droplets reflect more energy, which the radar displays as brighter, "hotter" colours. So the radar is really a map of precipitation intensity, updated every few minutes. The Bureau operates a national network of more than 60 radars, giving near-continuous coverage across the populated coast and much of the interior.
How do you read the colour scale?
The colour key runs from light to intense. As a rule of thumb:
| Colour | What it usually means |
|---|---|
| Light blue | Very light rain or drizzle |
| Green | Light to moderate rain |
| Yellow | Moderate to heavy rain |
| Orange | Heavy rain; a developing storm |
| Red | Very heavy rain; likely thunderstorm |
| Purple / white | Intense: torrential rain and possibly large hail |
Solid blocks of red and purple, especially with sharp, well-defined edges, are the signature of a severe thunderstorm. Bear in mind the radar measures intensity, not hail directly, but the most intense echoes are where large hail is most likely.
Which radar range should you use?
Most BOM radars offer several ranges: typically 512 km, 256 km, 128 km and 64 km. Use them for different jobs:
- 512 km and 256 km give the big picture: is a band of rain approaching from the west, is a storm complex still hours away?
- 128 km is the everyday workhorse for tracking storms toward your suburb.
- 64 km zooms in for the finest detail once a storm is close, showing individual cells and their structure.
The shorter ranges update more often and show more detail; the longer ranges trade detail for a wider view.
How do you use the loop to nowcast?
The single most useful trick is to play the animation. A still image tells you where the rain is; the loop tells you where it is going. Watch several frames to judge the direction cells are moving and how fast, then project that motion forward to estimate when the rain will reach you. Also watch whether echoes are growing brighter and larger (a strengthening storm) or fading (a weakening one). This short-range, radar-based prediction is what meteorologists call "nowcasting", and for the next hour or two it often beats any computer model.
What can the radar not see?
The radar is powerful but has real blind spots, and reading it well means knowing them:
- Beam blocking and radar shadow: hills and mountains can block the beam, leaving gaps behind them where rain shows up weaker than it really is or not at all.
- The beam rises with distance: far from the radar the beam is high above the ground, so it can miss shallow, low-level rain, or show rain aloft that evaporates before it lands (virga).
- Ground clutter: buildings, terrain and sometimes flocks of birds or insects can produce false echoes near the radar.
- Coverage gaps: parts of remote inland Australia sit beyond radar range altogether.
Some BOM radars are also Doppler radars, which can measure the wind moving toward or away from the radar, useful for spotting the rotation inside a severe storm.
What is the difference between the radar and the rainfall totals?
It is worth knowing that the live radar and BOM's rainfall maps are not the same thing. The radar shows intensity at this instant: how hard it is raining right now. To see how much rain has actually accumulated, use the Bureau's rainfall observations and the radar-derived rainfall product, which adds up the estimated totals over time. A cell that flashes red on the radar for only a few minutes may drop far less than a slow-moving band of steady yellow that sits over the same catchment for hours. When you are worried about flash flooding, both pieces, how intense and how persistent, matter.
How often does the radar update?
Individual radars refresh their image every few minutes, commonly around every six to ten minutes depending on the site and product, and the standard online loop stitches together roughly the last hour of frames. If the loop looks frozen, it usually means the latest scan has not yet uploaded rather than that the weather has stopped; give it a moment and refresh. Keeping an eye on the timestamp on each frame tells you how current the picture really is, which matters a great deal when a storm is bearing down.
How does radar compare with the forecast models?
Radar and forecast models answer different questions. Radar tells you what is happening right now and for the next hour or two; the global models tell you what to expect over the coming days. At checkweather.io we line up ECMWF (European), NOAA's GFS (American) and DWD's ICON (German) for the days-ahead view and turn their agreement into a plain-English forecast confidence score, then grade an accuracy scoreboard against what actually happened: no black boxes. When rain is imminent, though, nothing beats the live BOM radar, which is why we link straight through to it. Use the models to plan the week and the radar to run the afternoon.
If accuracy matters to you, compare the Australian models side by side and see which Australian forecast is most accurate.